
Happy #WeatherWednesday guys and gals! Have you always wondered what the meteorologists on TV or weather websites really mean when they say the atmosphere is stable or unstable? We will discuss what that means and how “the cap” or “CAPE” relate to these descriptors.
A stable atmosphere is characterized by air that is warmer aloft than the theoretical temperature of an air parcel that is vertically displaced from the surface. This warmer air can be a variety of thicknesses and magnitudes. In this context, the stability is stronger as this temperature differential between the atmosphere and the surface parcel increases and/or the as thickness that differential exists grows. This layer is called the cap. Colder air is denser than warm air and will SINK in the fluid atmosphere. Warm air RISES. Since you need air displacing upward to trigger thunderstorms, a cap will prohibit vertical motion and storms unless a “lifting mechanism” is strong enough to force air to erode the cap due to momentum and cooling effects of evaporation.
So what’s the opposite of stability and a cap? It is instability, or CAPE (Convective Available Potential Energy). This is the potential energy for a surface air parcel to accelerate **opposing gravity** upward until it reaches stability again. Here is where the environment is colder than the theoretical surface parcel temperature allowing the relatively warmer air to continue rising and developing convection, or storms. One of the key ingredients for severe organized storm potential is instability. The strongest storms require a thick layer of CAPE to maximize the energy utilized by surface air in updrafts, i.e. high velocity vertical motion which promotes larger hail, more frequent lightning, and sometimes tornadoes.
An environment can have a cap and no CAPE, CAPE and no cap, both a cap and CAPE, or sometimes very little or neither of both.
Check out this plot I sketched to show graphically what CAPE and a cap is. This is called a Skew-T log-P diagram and it graphs the expected surface parcel temperature and the observed ambient temperature and moisture (dew point). The red and green lines are drawn arbitrarily.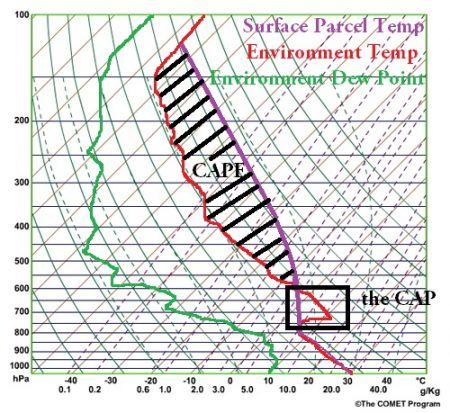
In this environment if air rises, it would cool at the rate of the purple line defined by thermodynamic principles about entropy – yikes! Note: the temperature axis lines are SKEWED. The surface air encounters the cap in the box where the atmospheric temperature is warmer than it is. If enough lift and momentum in present, or this cap were to weaken or vanish, the condensed surface air (cooling at around 6.5 Celsius per Kilometer) will rise and be warmer than the ambient temperature. The top of the convective layer is where the purple line intersects the red line again at the top of the graph.
In addition to this lesson it is important to note lifting mechanisms are needed to force surface air upward into the atmosphere, breach any cap, and trigger storms if there is sufficient CAPE. These include cold fronts, warm fronts, dry lines, outflow boundaries, sea breezes, gravity waves, mountainous terrain, differential surface heating, etc. Forecasters will be quick to predict storms if any of these is present with a weak cap and CAPE existing throughout a thick layer.
Not sure you learned everything you wanted to? Email Jason at [email protected] for any questions. I do try and keep the #WeatherWednesday posts brief and concise!
0 Comments