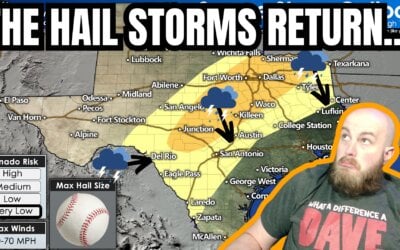
https://youtu.be/in89kq7bffI?si=onXbJ5fitTj0HUR_ The chance of severe thunderstorms – capable of producing damaging...
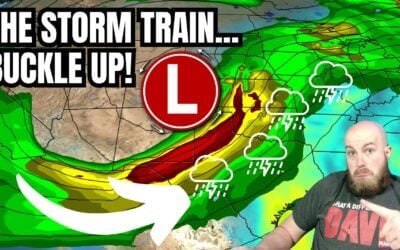

https://youtu.be/in89kq7bffI?si=onXbJ5fitTj0HUR_ The chance of severe thunderstorms – capable of producing damaging...

Many have asked, and we're happy to share that we have finally created a graphic with a Texas regional map and...
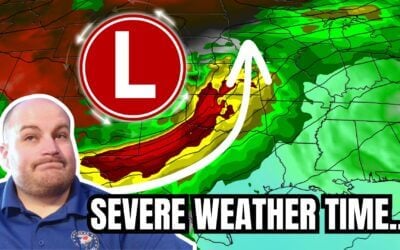
https://youtu.be/zy9FD0hSq28 Daily chances for rowdy thunderstorms and windy conditions will be two weather concerns...
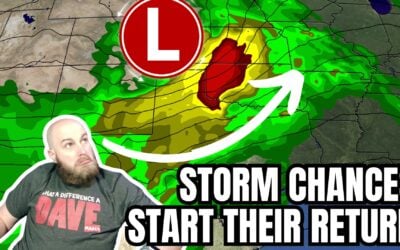
https://youtu.be/g0SO_5TdB8M Unsettled weather will bring a return of thunderstorm chances to parts of Texas over the...
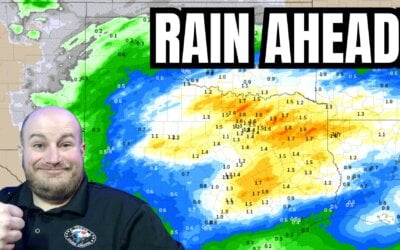
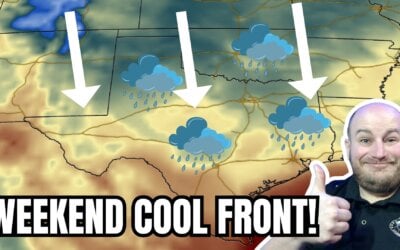
https://youtu.be/tZd6BxRdH_o A strong cold front will bring a little chill back to Texas this weekend with widespread...
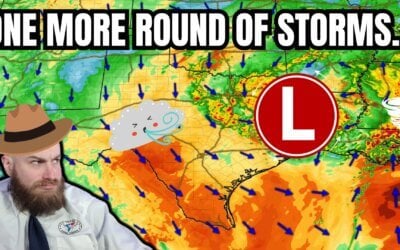
https://youtu.be/f0Z3y4lc-_0 Active weather returns to Texas for the remainder of the week. Today's scattered severe...
https://www.youtube.com/watch?v=czAhPxWGG0Q A few showers and storms with small hail are possible in the Ark-La-Tex...
NOT for rebroadcast or embedding. Email us at...
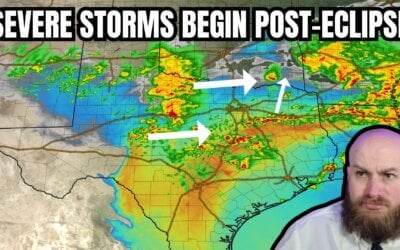
A total solar eclipse followed by a two-day severe weather outbreak has made for a busy week across Texas. We have one...
April 9, 2024 #LIVE #Texas #Tornado coverage from Baldy-in-Chief David...
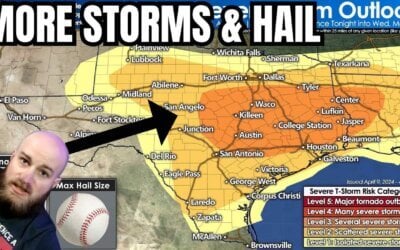
Thunderstorms will be the name of the game in Texas today, with continued chances of large hail and flooding rains in...
April 8, 2024 #LIVE #Texas #Tornado coverage from Baldy-in-Chief David...
April 8, 2024 #LIVE #Texas #Tornado coverage from Baldy-in-Chief David...
https://youtu.be/6sFEDoc8qbs The eclipse is hours away and clouds are moving north from the Gulf of Mexico. An...
Good evening! Here is a 9:30 pm update on tomorrow’s cloud cover potential...
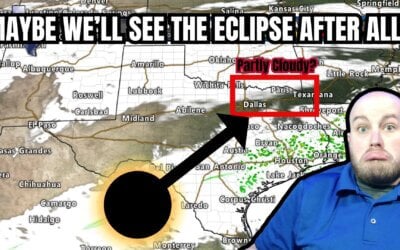
https://youtu.be/inRPdmYrUk4 Texas is one day away from experiencing a generational event – a total solar eclipse....
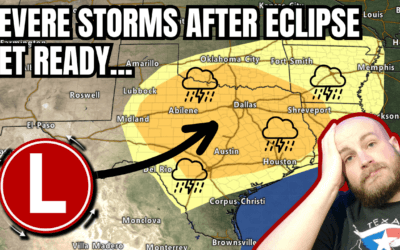
A multi-faceted, multi-day severe thunderstorm and flooding event will follow an eclipse in Texas next week. The...
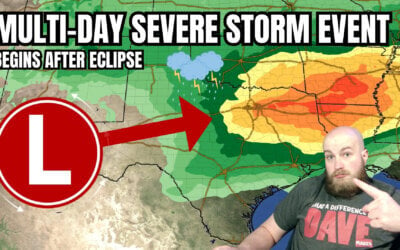
A multi-day severe storm event will follow an eclipse in Texas next week. Somehow, I figured Mother Nature wouldn’t...
https://youtu.be/4F1q4r6gfh0 Parts of Texas will start April off with a literal bang—with the possibility of severe...
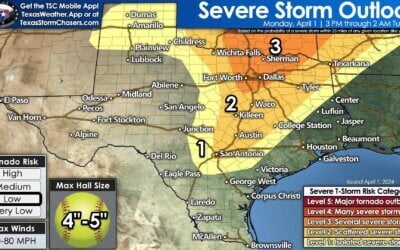
The potential for several intense supercell storms this afternoon and evening has increased in Texoma and North Texas...